Partition Coefficient
Partition Coefficient
The partition coefficient is the equilibrium distribution of an analyte between the sample phase and the gas phase.
Samples must be prepared to maximise the concentration of the volatile components in the headspace and minimise unwanted contamination from other compounds in the sample matrix. To help determine the concentration of an analyte in the headspace, you will need to calculate the partition coefficient (K).
K values of common solvents in air-water systems at 40°C
Solvent
Cyclohexane
n-Hexane
Tetrachlorethylene
1,1,1-Trichlormethane
O-Xylene
Toluene
Benzene
Dichlormethane
K Value
0.077
0.14
1.48
1.65
2.44
2.82
2.90
5.65
Solvent
n-Butylacetate
Ethylacetate
Methylethylketone
n-Butanol
Isopropanol
Ethanol
Dioxane
K Value
31.4
62.4
139.5
647
825
1355
1618
Calculating the Partition Coefficient
| Solvent | Cyclohexane | n-Hexane | Tetrachlorethylene | 1,1,1-Trichlormethane | O-Xylene | Toluene | Benzene | Dichlormethane |
| K Value | 0.077 | 0.14 | 1.48 | 1.65 | 2.44 | 2.82 | 2.90 | 5.65 |
| Solvent | n-Butylacetate | Ethylacetate | Methylethylketone | n-Butanol | Isopropanol | Ethanol | Dioxane | |
| K Value | 31.4 | 62.4 | 139.5 | 647 | 825 | 1355 | 1618 |
Partition Coefficient (K) = Cs/Cg
where:
Cs is the concentration of analyte in sample phase;
Cg is the concentration of analyte in gas phase
Partition Coefficients of Common Compounds
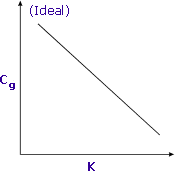
Compounds that have low K values will tend to partition more readily into the gas phase and have relatively high responses and low limits of detection. An example of this would be hexane in water: at 40°C, hexane would have a K value of 0.14 in an air-water system.
Compounds that have high K values will tend to partition less readily into the gas phase and have relatively low responses and high limits of detection.
An example of this would be ethanol in water: at 40°C, ethanol has a K value of 1355 in an air-water system.
Partition coefficient values for other common compounds are shown in the table above.
Changing the Partition Coefficient
 |
Sensitivity is increased when K is minimised |
Adding Inorganic Salts
High salt concentrations in aqueous samples decrease the solubility of polar organic volatiles in the sample matrix and promote their transfer into the headspace, resulting in lower K values. The magnitude of the salting-out effect on K, however, is not the same for all compounds.
Compounds with K values that are already relatively low will experience very little change in the partition coefficient after adding a salt to an aqueous sample matrix.
Generally, volatile polar compounds in polar matrices (aqueous samples) will experience the largest shifts in K and have higher responses after the addition of salt to the sample matrix.
Common salts used to decrease matrix effects:
- Ammonium chloride
- Ammonium sulphate
- Sodium chloride
- Sodium citrate
- Sodium sulphate
- Potassium carbonate
The value of K is also dependent on the Phase Ratio. This is discussed in the next section.
Phase Ratio
The phase ratio (β) is defined as the relative volume of the headspace compared to volume of the sample in the sample vial.
Calculating the Phase Ratio where: Vs is the volume of sample phase |
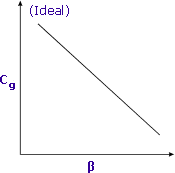
 Sensitivity is increased when β is minimised Sensitivity is increased when β is minimised |
Lower values of β (i.e. larger sample size) will yield higher responses for volatile compounds.
Decreasing the β value will not always yield the increase in response needed to improve sensitivity.
When β is decreased by increasing the sample size, compounds with high K values partition less into the headspace compared to compounds with low K values and yield correspondingly smaller changes in Cg.
Samples that contain compounds with high K values need to be optimised to provide the lowest K value before changes are made in the phase ratio.
Combining Partition Coefficient and Phase Ratio

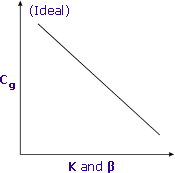
Lower K and β result in higher Cg and better sensitivity
Partition coefficients and phase ratios work together to determine the final concentration of volatile compounds in the headspace of sample vials.
The concentration of volatile compounds in the gas phase can be expressed as:
Cg = Co / (K + β)
where
Cg is the concentration of volatile analytes in the gas phase
and
Co is the original concentration of volatile analytes in the sample.
Striving for the lowest values for both K and β will result in higher concentrations of volatile analytes in the gas phase and therefore better sensitivity.